Kripto paraların Python ile kolerasyonlarını inceleme
01 Feb 2022
Detayları ile anlattığım videonun LINK. Bununla birlikte kodun da LINK
Kodun örnek yansısı
from binance import Client
binance_cli = Client(API_KEY, API_SECRET)
tickers = binance_cli.get_exchange_info()
tickers = [a["symbol"] for a in tickers["symbols"]]
usdtPairs = []
btcPairs = []
exclude = ["DOWN", "UP", "BULL", "BEAR", "YEN", "TRY", "EURO", "EUR", "TUSD", "BUSD", "USDC", "USDS"]
for ticker in tickers:
if ticker.endswith("USDT") and all(element not in ticker for element in exclude):
usdtPairs.append(ticker)
elif ticker.endswith("BTC"):
btcPairs.append(ticker)
usdtPairs
import pandas as pd
"""
[
1499040000000, # Open time
"0.01634790", # Open
"0.80000000", # High
"0.01575800", # Low
"0.01577100", # Close
"148976.11427815", # Volume
1499644799999, # Close time
"2434.19055334", # Quote asset volume
308, # Number of trades
"1756.87402397", # Taker buy base asset volume
"28.46694368", # Taker buy quote asset volume
"17928899.62484339" # Can be ignored
]
"""
binance_cli.get_klines(symbol = "BTCUSDT" , interval = '4h', limit = 10 )
def getData(symbol ,interval = "4h", limit = 10):
subFrame = pd.DataFrame(binance_cli.get_klines(symbol = symbol , interval = interval, limit = limit ))
subFrame = subFrame.iloc[:, :6]
subFrame.columns = ["Time", "Open", "High", "Low", "Close", "Volume"]
subFrame = subFrame.set_index("Time")
subFrame.index = pd.to_datetime(subFrame.index, unit="ms")
subFrame = subFrame.astype(float)
return subFrame
arr = []
for pair in usdtPairs[0:50]:
df = getData(pair)
print("Getting Klines for", pair)
arr.append(getData(pair))
dict(zip(usdtPairs[0:50], arr))
df = pd.concat(dict(zip(usdtPairs[0:20], arr)), axis=1)
closedf = df.loc[:, df.columns.get_level_values(1).isin(["Close"])]
closedf.columns = closedf.columns.droplevel(1)
closedf = closedf[closedf.iloc[-1].dropna().index].dropna()
closedf
import numpy as np
"""# Log return formula
log(percentage change + 1) -> (log is a natural logarithm)
OR
log(final element / initial element) -> (log is a natural logarithm)
## Cumulative Return
exp(sum(all log returns)) - 1
"""
example = pd.Series(np.random.randint(1,5,5))
example.pct_change()
print(np.log(example.pct_change()[2] + 1), np.log(example[2] / example[1]), np.exp(sum(np.log(example.pct_change()[1::] + 1))) - 1)
np.expm1(sum(np.log(example.pct_change()[1::] + 1)))
log_df = np.log(closedf.pct_change() + 1)
log_df.drop(closedf.index[0], inplace=True)
log_df
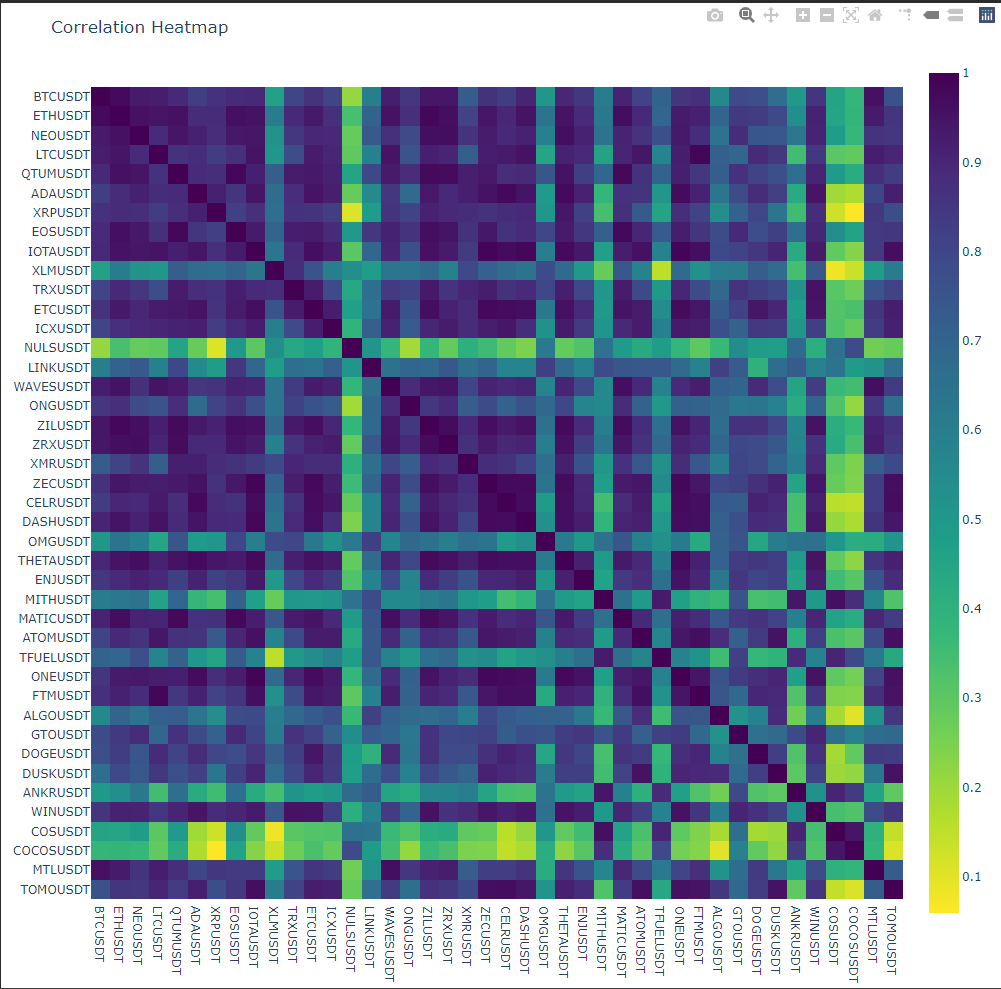
log_df.corr()
import plotly.express as px
corr = log_df.corr()
fig = px.imshow(corr, color_continuous_scale=px.colors.sequential.Viridis_r)
fig.update_layout(title="Correlation heatmap",
height=1000,
width=1000,
xaxis_nticks=len(corr),
yaxis_nticks=len(corr),
)
fig.show()